The process of project quality assurance involves taking actions in order to certify the outcomes or objectives of the project compared to the expected or planned requirements. The overarching focus is to apply and maintain the quality standards and produce or create quality outcomes or deliverables (PMI 2021). According to the PMBOK, the process of quality assurance involves auditing quality requirements and results from quality control measures ensuring that appropriate quality standards and operational definitions are followed (PMI 2021). Quality assurance is the second component to be outlined within the quality management plan.
The majority of the work around quality assurance occurs in the execution phase; however, the assurance process occurs throughout. Quality assurance is about measuring the process rather than outputs.
Continuous improvement is a key component of the quality assurance process. This includes the implementation of the measurements outlined in the quality planning phase and tested as part of the quality control process. Quality assurance requires analysing the processes to understand if they are within the tolerance of the acceptable range and identifying where adjustments are necessary. Therefore, quality standards and methods are evaluated and updated as required. There are 4 primary components to good measurement systems in quality assurance (George et al. 2005):
It is critical that the project manager and project team allocates sufficient time and effort to ensure that the measurement system is accurate and credible. This impacts the credibility of decisions in the future. There are many tools and techniques which can be utilised as part of the quality assurance process. These are outlined below.
Within the quality assurance process there are 3 primary steps that need to be outlined within the project quality management plan:
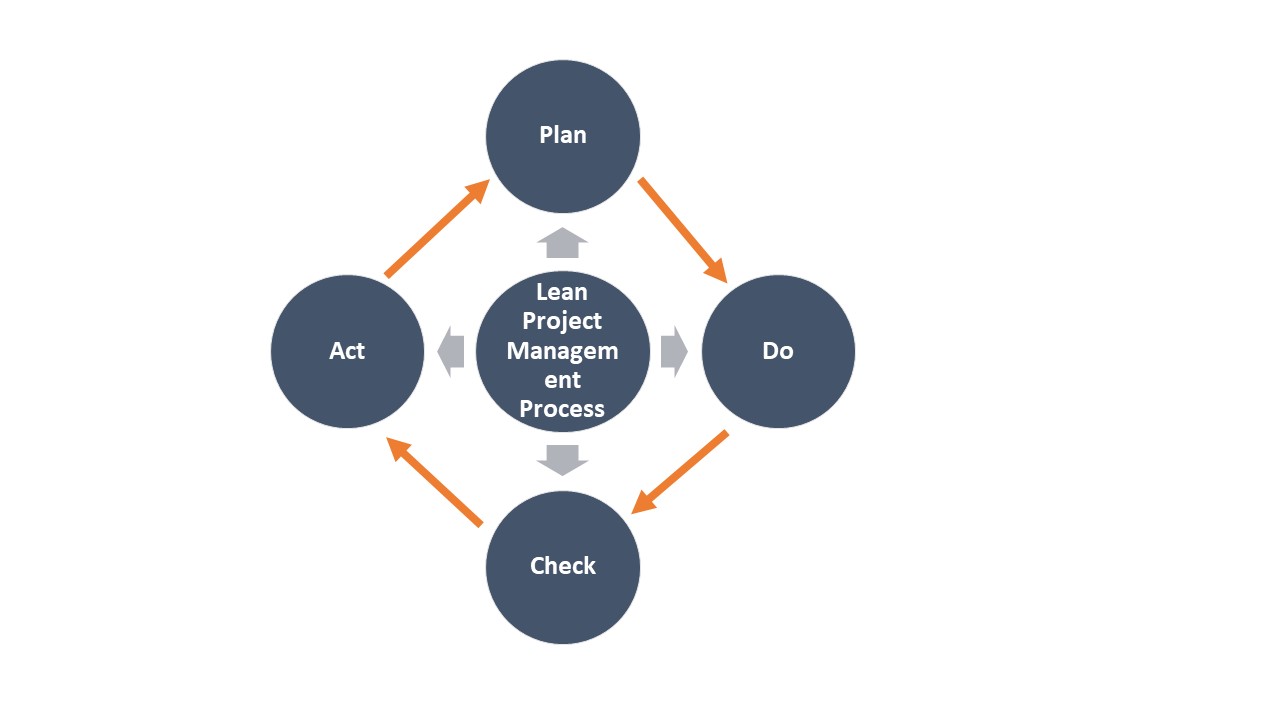
Often, improvements are one-time reviews or occurrences through the quality audits; however, the end-to-end aim is continuous improvement. Therefore, quality assurance is about ensuring improvements are a state of mind for everyone involved in the project. This often involves applying the Lean method of project management, which outlines a process based on 4 key stages. These are outlined in Figure 17.
Figure 17. Lean project management process, adapted from Womack and Jones (1996), by Carmen Reaiche, Samantha Papavasiliou and Frank Anglani, licensed under CC BY (Attribution) 4.0
Projects and organisations should operate within a process of continuous improvement. The continuous improvement process empowers all employees, regardless of rank, to seek opportunities to improve both their business-as-usual process and innovate overall. The focus is not specifically on seeking major improvements; instead, this process considers the importance of making many minor improvements over time. The management teams are encouraged to implement changes as they go and measure the success of these changes. This becomes a cultural change in the organisation and project overall and supports quality assurance processes.
Process analysis is a key component of conducting quality assurance. The purpose of process analysis is to review the project quality assurance processes and obtain understanding of what is working well and what can be improved. This involves reviewing each component within the project process, including the inputs, outputs, procedures, stakeholders, controls, data, technology, deliverables and governance requirements which all work together to create outcomes.
Quality assurance audits are used to assess consistency and ensure that processes are being used appropriately to achieve quality outcomes. Quality assurance audits often involve:
The project team members need to assess the current state and identify improvements within the quality and project processes. As root causes can be difficult to identify, a quality assurance audit will ensure that background information and research is sought.
Audit processes support the development of preventative and proactive actions. The level of confidence in the project outputs will be higher if these actions are documented, the stakeholders are engaged, and any issues are communicated early and often. The role of the quality assurance audit is to compare data from the quality control with other historical projects, or based on expected standards set by stakeholders or subject matter experts. These levels are set and shared with clients, sponsors and stakeholders.
The root-cause analysis is also referred to as a fishbone diagram, cause and effect diagram or Ishikawa diagram. These are causal diagrams which are used to show the potential causes of a specific event or situation (Ishikawa 1968). The diagram is used to assess the potential causes for the problem or issue under review (outlined in Figure 18). The diagram is created by first outlining the major causes on the ribs from the backbone, then listing minor causes or factors below the categories, on the left-hand side of the diagram. The effect (also referred to as the problem or defect) is positioned as the fish-head, on the right-hand side of the diagram.
Figure 18. Example of the Ishikawa diagram categories, by Carmen Reaiche, Samantha Papavasiliou and Frank Anglani, licensed under CC BY (Attribution) 4.0
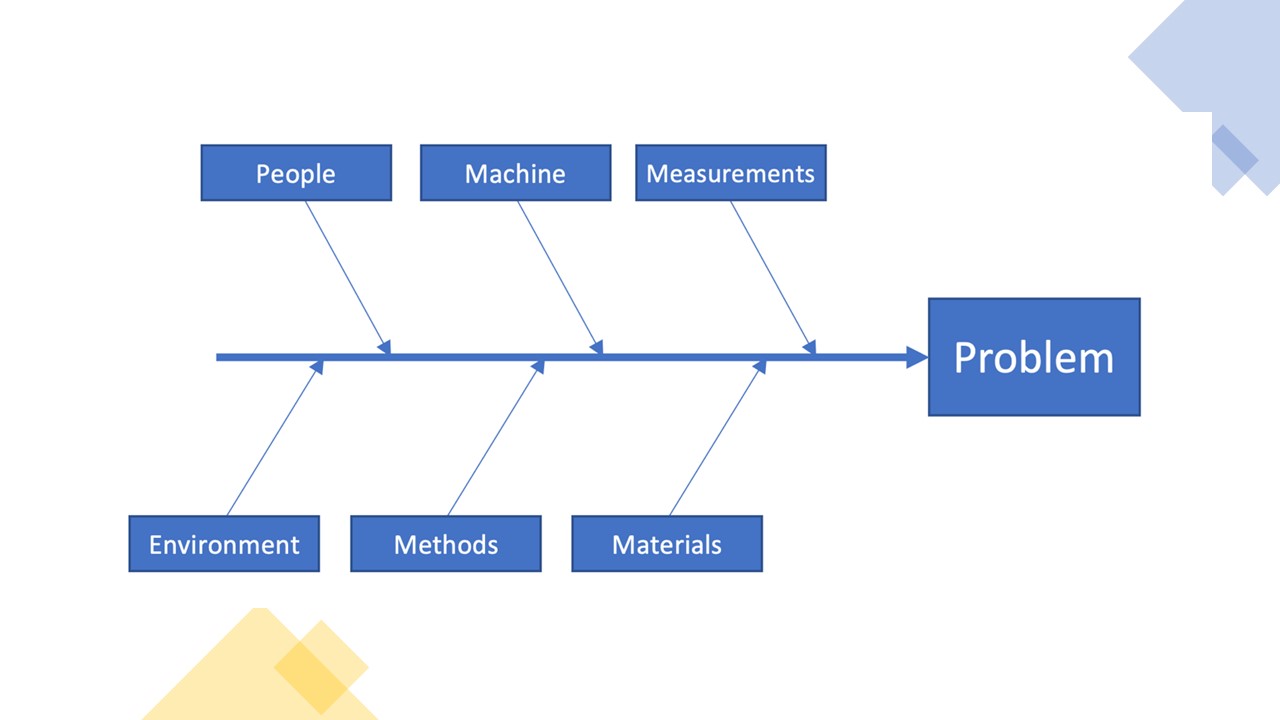
There are 6 common categories used within Ishikawa diagrams:
Identifying the potential causes can be simplified by using the ‘5 Whys’ technique (Tague 2004). This requires asking, ‘What are the potential causes of the problem?’ and then drilling down to key causes by asking ‘why’ five times. The responses need to be clear and concise but with sufficient detail. These causes can be identified through brainstorming with project stakeholders, team members and sponsors, and are grouped by the above categories (the bones of the fish backbone). Structure is provided by grouping the causes into primary categories. The process focuses on where improvements or corrective actions can be taken to reduce the impact of the problem or remove it entirely.
Advantages of the Ishikawa diagram:
Disadvantages of the Ishikawa diagram:
Affinity diagrams
Affinity diagrams are used to organise ideas from brainstorming sessions into their natural relationships or dependencies. Brainstorming is a process that supports idea generation. Affinity diagrams can be used to organise and consolidate information that is collected as part of this process. An example of an affinity diagram is provided in Figure 19. There are 4 common steps which are followed to create an affinity diagram:
Figure 19. Affinity diagram components example, by Carmen Reaiche, Samantha Papavasiliou and Frank Anglani, licensed under CC BY (Attribution) 4.0
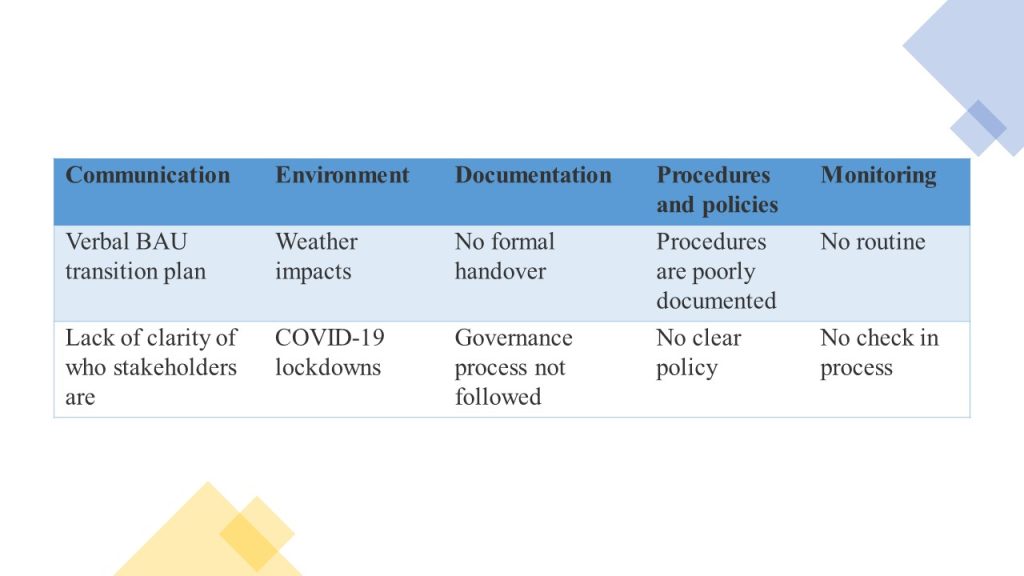
Affinity diagrams often contain similar information as Ishikawa diagrams but in a different format. The process can be used to develop the Ishikawa diagram content or support the cause-and-effect discussion for the process.
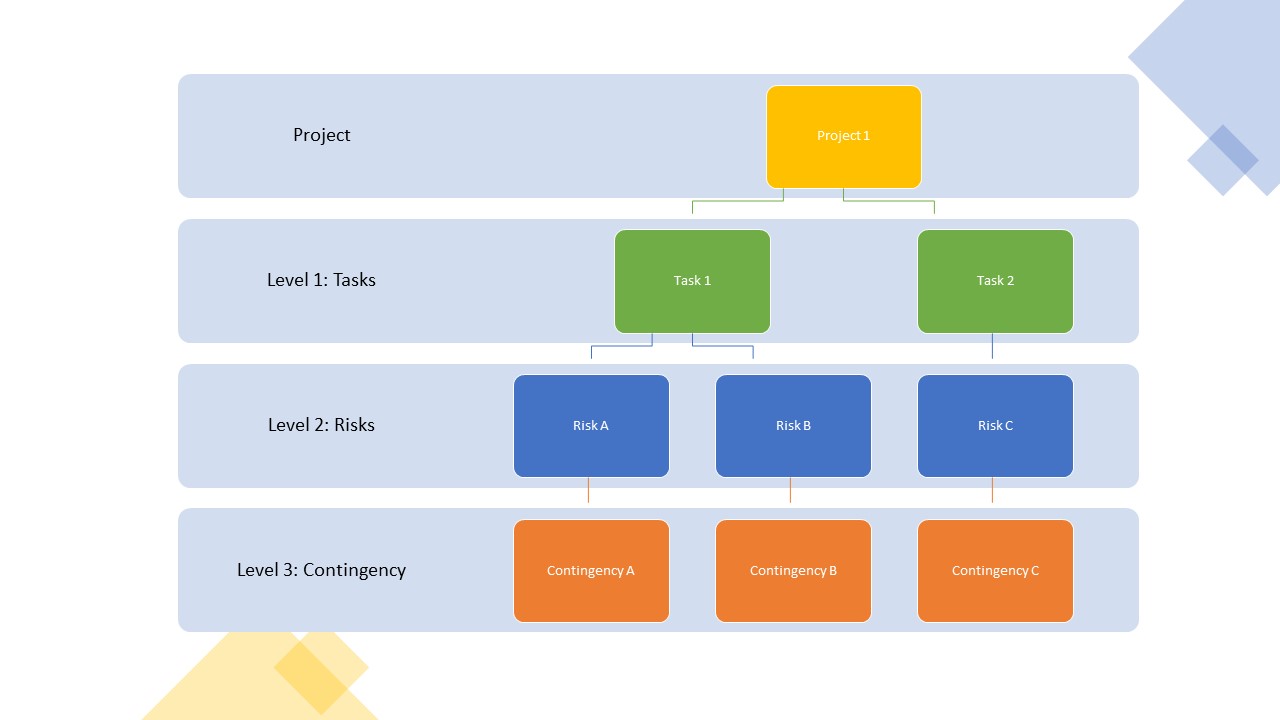
The process decision program chart is used to systematically identify what may go wrong in future projects or business changes (Tague 2004). These are used to create contingency plans, specifically focused on the impact of failure or risk. These process decision program charts contain 3 levels. The first level outlines the task or process under review, the second level outlines the potential risks or issues associated with the process, and the third level outlines the response plan for each identified risk. An example of a process decision program chart is outlined in Figure 20.
Figure 20. Example of a process decision program chart, by Carmen Reaiche, Samantha Papavasiliou and Frank Anglani, licensed under CC BY (Attribution) 4.0
Interrelationship diagrams help identify relationships between factors or causes within a complex situation or problem space. By using the diagrams, users are able to determine primary causal factors, and outline their interrelated elements. The process involves a number of steps, including:
An example of an interrelationship diagram is provided in Figure 21. It highlights that each cause has many arrows which flow in and out.
Figure 21. Example of an interrelationship diagram, by Carmen Reaiche, Samantha Papavasiliou and Frank Anglani, licensed under CC BY (Attribution) 4.0
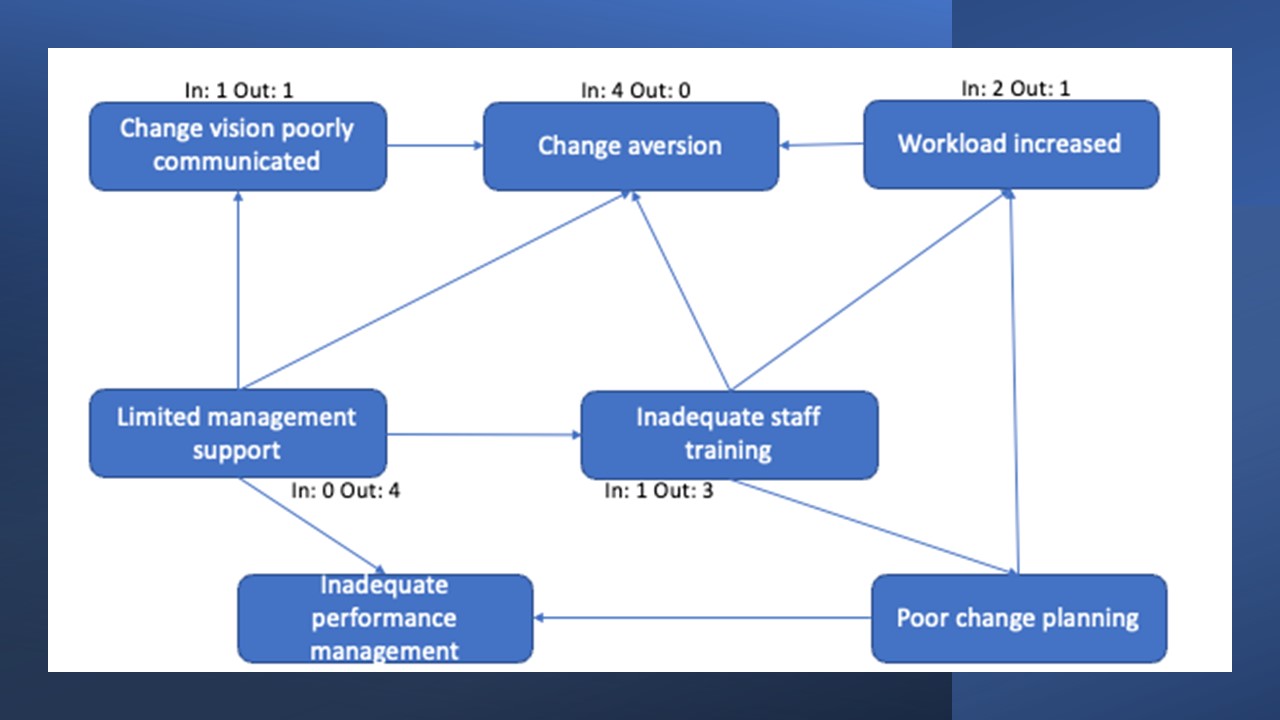
The interrelationship diagram can be interpreted through 3 primary steps:
Using Figure 21 as an example of an interrelationship diagram, the project team can see what factors need to be understood and what will impact the project. In this example, limited management support has the most significant impact on the project and causes change aversion. As a result, the project team can target the limited management support and impact outcomes.
Tree diagrams can be used to visualise the relationships between the different tasks, activities and processes. Identifying the dependent relationships outlines the primary causes of quality failures. It outlines the hierarchies within the relationships (e.g., tasks and subtasks). To create a tree diagram, the project team starts by identifying one factor which branches into two or more. Each branch will have two or more, and so forth. The completed diagram resembles a tree. A tree diagram will help break down broad factors into finer detail. There are several steps which need to be followed to create a tree diagram:
Figure 22. Example of a tree diagram, by Carmen Reaiche, Samantha Papavasiliou and Frank Anglani, licensed under CC BY (Attribution) 4.0
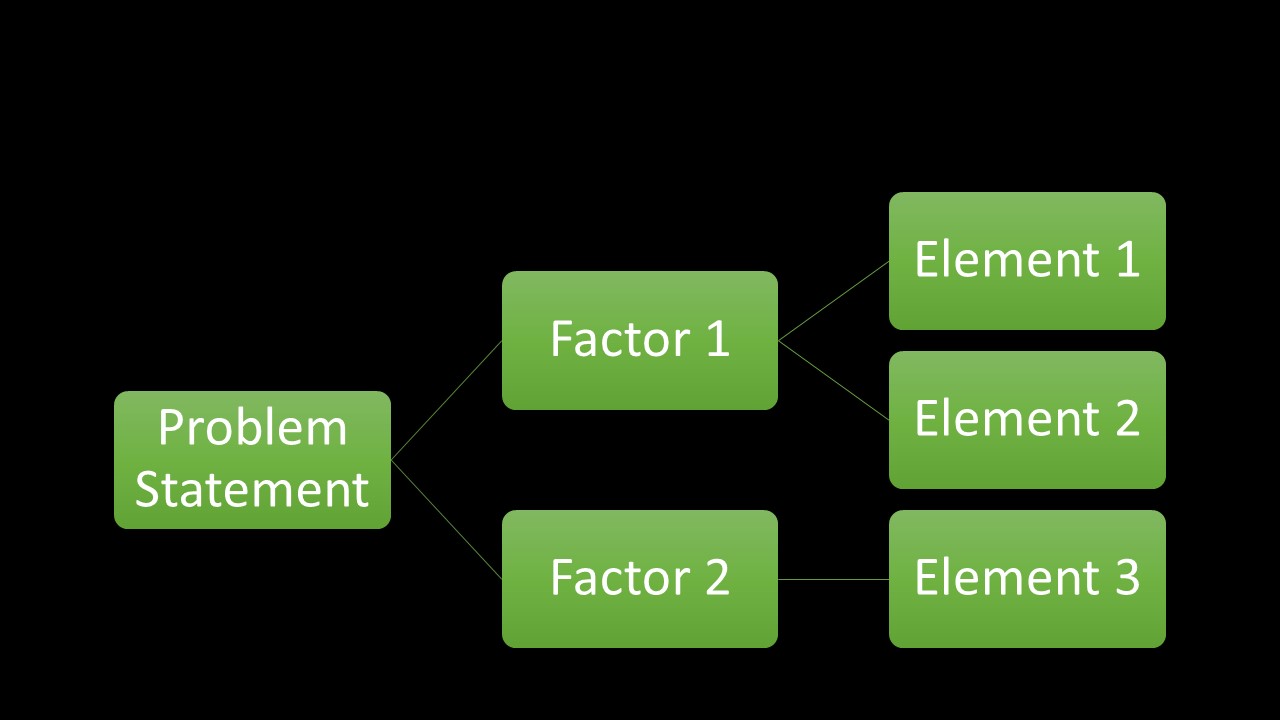
An example of a tree diagram is demonstrated in Figure 22. It provides a visual representation of the entire problem and allows the project team to see the relationships across and between the different factors and elements.
A cost-benefit analysis (CBA) is used to estimate both costs and benefits from the implementation of a project or activity. CBA is used to determine the most cost-effective project or process. The purpose is to determine the feasibility of different opportunities and create baselines to measure against. There are numerous steps to undertake in the CBA process:
This method allows a project team to determine what resources are used to ensure good quality versus poor quality. This calculation encourages the project team to share how much it will cost to repair quality issues (or non-conformance) compared to how much it will cost to ensure quality conformance.
This relates to the 1-10-100 rule, which states that proactive or preventative actions require less resources, time and budget than correcting issues that have happened. Per this rule, it will cost $1 to verify the data as its being collected, it costs $10 to clean data post collection, and it costs $100 to input no quality checks (Omachonu and Ross 2004).
These are costs or processes associated with fixing issues or correcting actions to fix poor quality outcomes (PMI 2021). The cost of non-conformance is higher than implementing conformance measures to ensure quality. These include 2 key categories:
This outlines the amount of resources required to ensure that the quality requirements are met (PMI 2021). These include 2 key categories:
How to calculate cost of quality:
COQ = Cost of Conformance + Cost of Non-Conformance (or failure costs)Cost of conformance includes the sum of all the costs associated with prevention and appraisal. Whereas cost of non-conformance includes the sum of all external and internal failure costs.
Now let’s revise our knowledge:
Key Takeaways
References
George LM, Rowlands D, Price M and Maxey J (2005) The Lean Six Sigma pocket toolbook, McGraw-Hill, New York.
Ishikawa K (1968) Guide to quality control, JUSE, Tokyo.
Omachonu VK and Ross JE (2004) Principles of total quality, 3rd edn, Taylor & Francis, Florida.
Project Management Institute (2021) A guide to the project management body of knowledge (PMBOK® Guide), 7th edn, Project Management Institute, Newtown Square, PA.
Tague N (2004) The quality toolbox, ASQ Quality Press.
Womack J and Jones D (1996) Lean thinking: banish waste and create wealth in your corporation, Simon & Schuster, New York.
Risk Assessment and Quality Project Management Copyright © 2022 by Carmen Reaiche, Samantha Papavasiliou and Frank Anglani is licensed under a Creative Commons Attribution 4.0 International License, except where otherwise noted.